Graphics
In the Graphics screen you will be able to see the curves of Corrected Power, Corrected Torque and any other variable measured by the system, such as lambda probe, or temperatures.
To select the channels to display, first select a number from 1 to 9 in the upper buttons and then configure that position by double clicking on the graph or pressing the options button.
There you can choose which channels to view.
CHANNELS
To differentiate channels from the same run, select a different line thickness for each channel. Keep in mind that all the channels are seen in the same color since the colors are automatically assigned to be able to compare tests. So you can choose for example a thickness 3 for the corrected power and a thickness 1 for the corrected torque.
In the toolbar buttons you can select the amount of smoothing for the curves to smooth them more or less to see finer details.
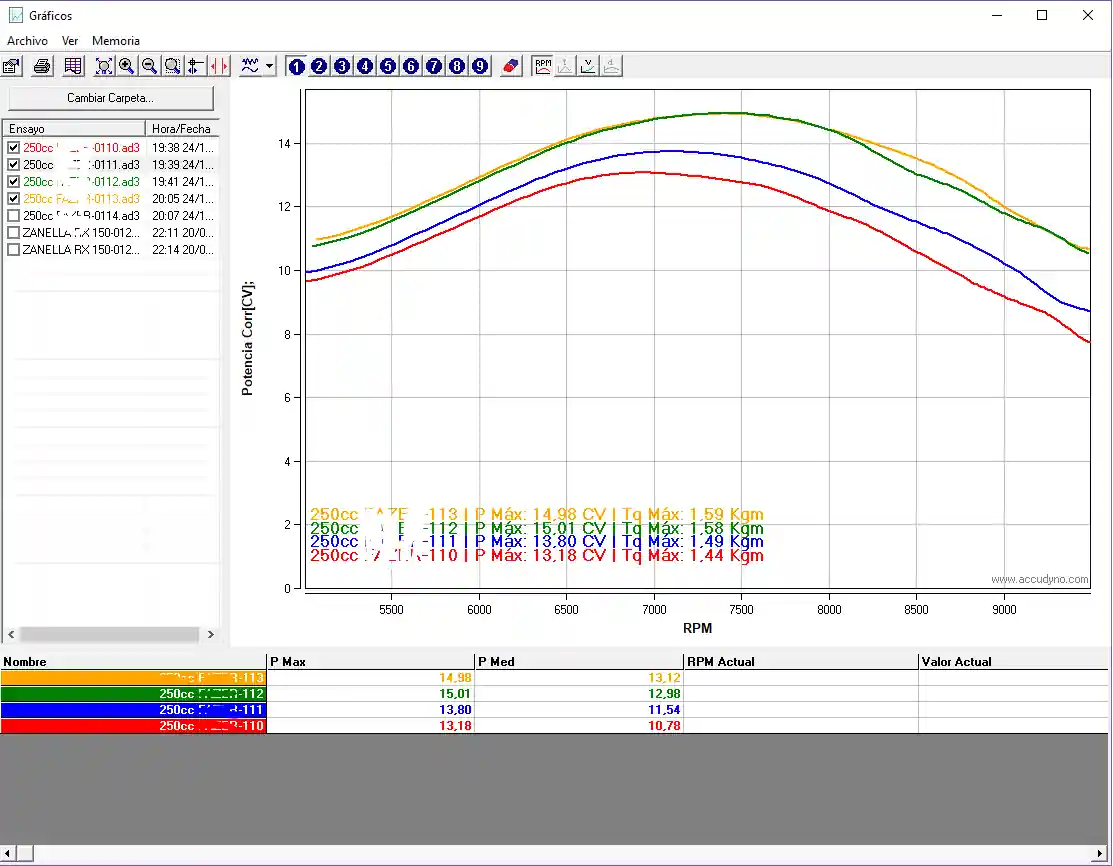
To compare dyno runs first click the Change Folder button to select the folder that contains the test files for comparison. Then check the tests you want to compare. At the bottom you will see a summary of average and maximum powers. This part is under development and new features will be added soon.
CORRECTED VALUES
It is important to always work with the climate corrected values. These have the climate correction factor applied, which helps compensate for variations in power with changing weather.