Report
The report gives the results of the test in table format. The columns correspond to all the channels that are stored and you can display any them.
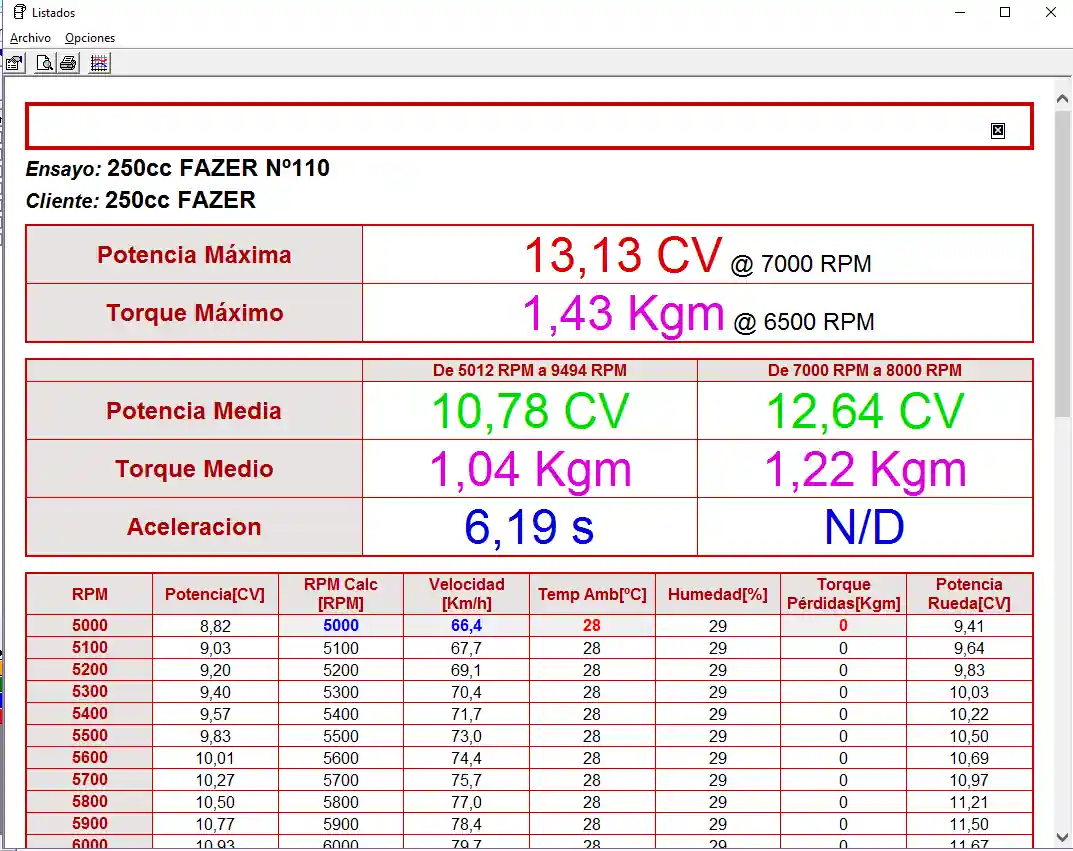
To select the columns to display in the table, press the Properties button.
In the Options menu you can select the range for the averages.
AVERAGES
You can view averages for the entire test and for another RPM range of the same test.
You can also configure the color of the report, and your company information in the header. You can add a logo to the report for printing.
You can work with the different data delivered. If you are not sure what value to consider, we recommend always working with the Average Power. It is a more interesting and representative data than the Maximum Power.
If you use the acceleration time, keep in mind that it can change depending on the vehicle's gear ratio and also changes depending on weather conditions. Unlike the Corrected Power, Maximum Power and Average Power, which, being climate corrected, compensate for changes in weather conditions and tend to show the most stable and correct value.